 Sign-up for free online course on ANSYS simulations!
Step 8: Postprocess the results
...
The title bar for the Results Viewer indicates that the results are being read from the shell.rst file. Rearrange the windows slightly so that you can access the Results Viewer, ANSYS GUI and tutorial simultaneously.
Under Choose a result item, select Nodal Solution > DOF Solution > Displaced structure. Click on the Plot Results icon.
Hold down the Ctrl key and use the mouse to manipulate the model view;check that the BC's and loads have been imposed correctly. The snapshot below shows one view that is useful in checking the BC's. Are the symmetry and clamped conditions satisfied at the corresponding edges for the facesheet as well as the stiffeners? Is the model deformation as you'd expect for a uniform pressure on the facesheet in the +z direction?
...
Results Viewer > Animate Results > Deformed Shape > OK > Def + undef edge > OK
Select Forward Only in the Animation Controller.
...
In the Results Viewer, in place of Displaced structure, choose Nodal Solution > DOF Solution > Z-Component of displacement. Click on the Plot Results icon.
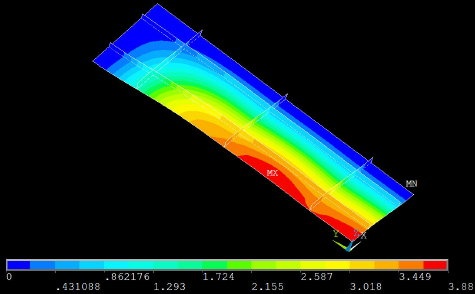
The location of maximum deflection wmax is labeled MX. This occurs not at the facesheet center but on the edge x=0, at approximately y=L1/3. As expected, the deflection is zero along the clamped edges.
...
To query the value of the deflection at the center of the facesheet, select the Query Results icon in the Results Viewer.
Pick the node at X=0, Y=0. The coordinates of the picked node and the corresponding value of UZ (i.e. w displacement) are displayed in the Query Subgrid Results menu. The deflection at the center of the facesheet is 3.8 mm.
Cancel the Query Subgrid Results menu.
...
Select Entities menu: Select Areas, By Location and Z coordinates. Under Min,Max, enter 0. Make sure From Full is selected. Click Apply.
Following this, select Elements, Attached to, Areas and From Full. Click Apply and then Replot. You should see that only elements for the facesheet are currently selected.
Main Menu > General Postproc > Results Viewer > Nodal Solution > Stress > X-Component of stress
Click Plot Results icon.
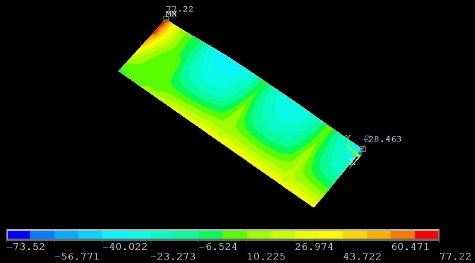
Shell theory provides the stresses through the thickness of the shell. This is illustrated in the help page for SHELL93 element. If, like me, you are looking at the top of the facesheet, then the contours values correspond to σxx values for the top face. Check the σxx value for the top face at the facesheet center:
...
Hold down the Ctrl key and flip the model over so that you are looking at the bottom of the facesheet as in the snapshot below. Now the contours values correspond to σxx values for the facesheet bottom. Use Query Results to determine σxx at the center-bottom of the facesheet. I get -56 MPa. What do you get? The negative sign indicates compression.
...
Thus, at the facesheet center, σxx varies from a tensile stress of 51 MPa at the top to a compressive stress of 56 MPa at the bottom.
Using Query Results, I get σxx=116 MPa at the edge point x=W1, y=0 for the bottom of the facesheet (see snapshot above). What's the value you finagled out of ANSYS?
Do these values look plausible? We'll investigate this in Step 9 when we compare the center and edge stress values to plate theory.
Cancel the Query Subgrid Results menu.
...
Results Viewer > Nodal Solution > Stress > Y-Component of stress
Click Plot Results icon. The snapshot below shows the σyy contours.
Using Query Results, I get the following values for the bottom of the facesheet (see snapshot above):
...
Results Viewer > Nodal Solution > Stress > X-Component of stress
Click Plot Results icon.
Manipulate the view so that you are looking down on the top of the stiffeners as in the snapshot below. You might have to flip the model over.
...
The σxx values for the stiffeners in the y-direction is virtually zero; confirm this using Query Results. This means that, as expected, the load in the x-direction is carried by the stiffeners in that direction.
...
The σyy values for the stiffeners in the x-direction is virtually zero; confirm this using Query Results. This means that, as expected, the load in the y-direction is carried by the stiffeners in that direction.
Let's determine σyy values at the top of the y-stiffener closest to the center which we'll compare to plate theory in Step 9. Using Query Results, I get the following values at the top of the stiffener (see snapshot above):
...