Read more on phases of rowing. Created diagram based on what I've read & web sources: 
Figure 1: Diagrams to parts of the rowing stroke. 4 main parts: Catch, drive, finish, recovery.
Got in contact with Gregg about using Vicon system. A guy named Michael from Prof Jane Wang's lab opened the door for us. We came in on Saturday and Gregg taught us how to calibrate and setup the cameras. We tested with various camera positions, but due to time constraints, did not get to actually collect data and do a trial run.
After the cancelled skype meeting with Prof Ruina on Sunday, we went to Dollar Tree and Target to buy some supplies like black table cloth, posterboard, and trifold (cardboard) to prep the erg for use of the Vicon system. (The Vicon system uses infrared to track the points... any reflective surfaces such as shiny metal plates have to be covered.)
We went back to the Vicon system on Monday to try to figure out how to collect data. We were able to create a "subject" and specify segments and joints on the system, but have no idea how to save data or where numerical values are stored. The interface for Vicon has very limited options and the only file types we have been able to find are .xcp and .cp, both of which we also do not know which other programs can use/open, or what specifically those files save. Gregg had said on Saturday that he was able to get position graphs from the system, while Song Chang (grad student of Prof Jane's) said that they had used another program to extract data from Vicon. Gregg seems to know the setup better, though, so we shot him an email again. 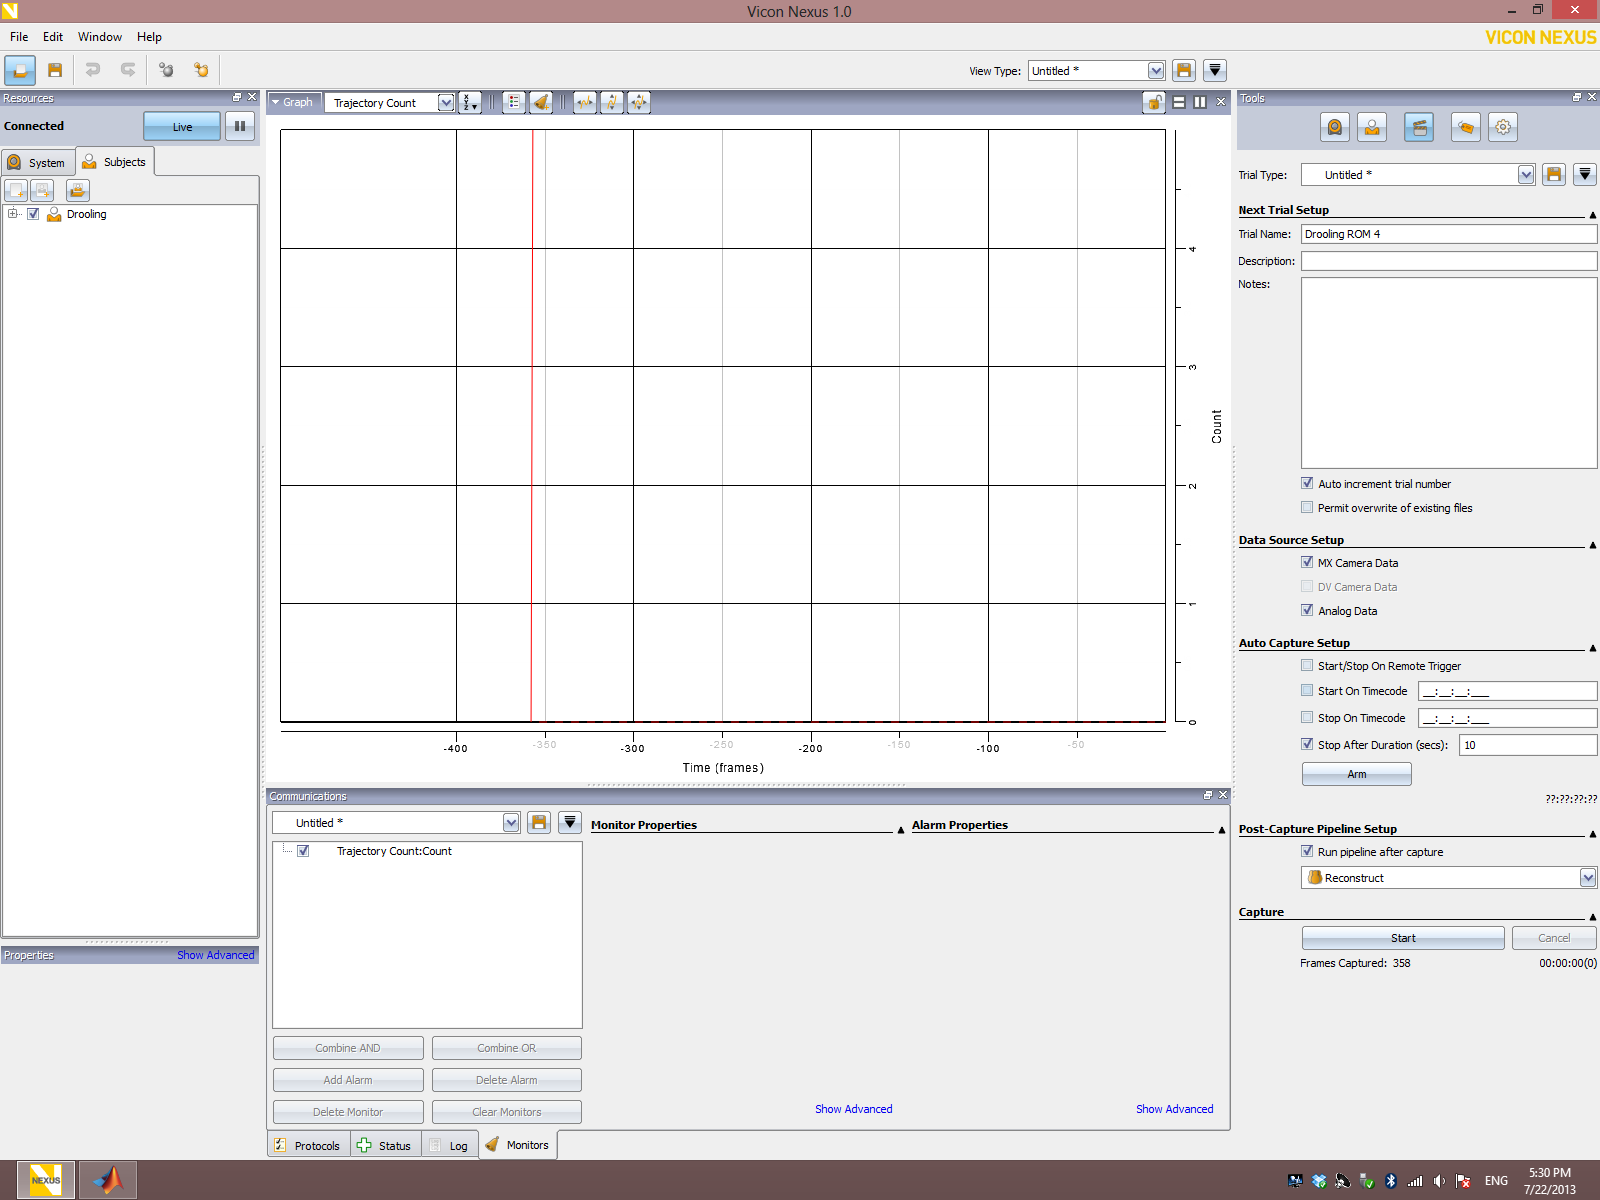
Figure 2: The only graph we have been able to generate so far is the Trajectory Count graph... but we're not sure what this entails.